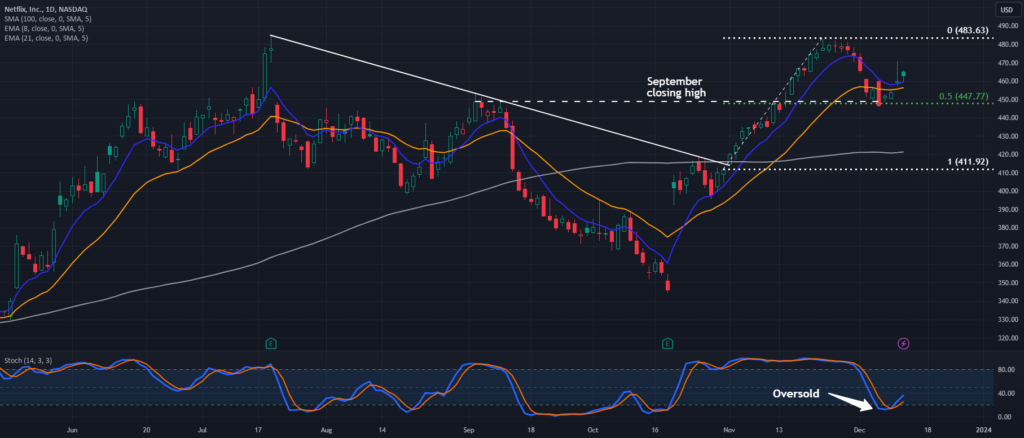
Netflix rallied sharply between mid-October and late November. Now, after a pullback, some traders may expect further upside. The first pattern on today’s chart is the September closing high of $448.68. NFLX held that level last week. Has old resistance become new support? Second, the price area matches a 50 percent retracement of the trendline breakout that followed our last idea on October 31. Third, the 8-day exponential moving average (EMA) has remained above the 21-day EMA. That may …

Netflix Holds a Tight Pullback for NASDAQ:NFLX by TradeStation
Netflix rallied sharply between mid-October and late November. Now, after a pullback, some traders may expect further upside. The first pattern on today’s chart is the September closing high of $448.68. NFLX held that level last week. Has old resistance become new support? Second, the price area matches a 50 percent retracement of the trendline…
Shares:

