Exchange: Binance
Project: New Kind of Network
Ticker: NKN
Sector: Cryptocurrency
Introduction:
Today, we are analyzing the NKN/USDT cryptocurrency on the daily scale chart, focusing on a crucial principle in trading – patience. It’s crucial to not jump into trades prematurely and we will be using the current state of NKN to illustrate this.
Rectangle Pattern:
In technical analysis, a Rectangle pattern forms during a consolidation phase, typically characterized by the price bouncing between clearly defined horizontal support and resistance levels.
Analysis:
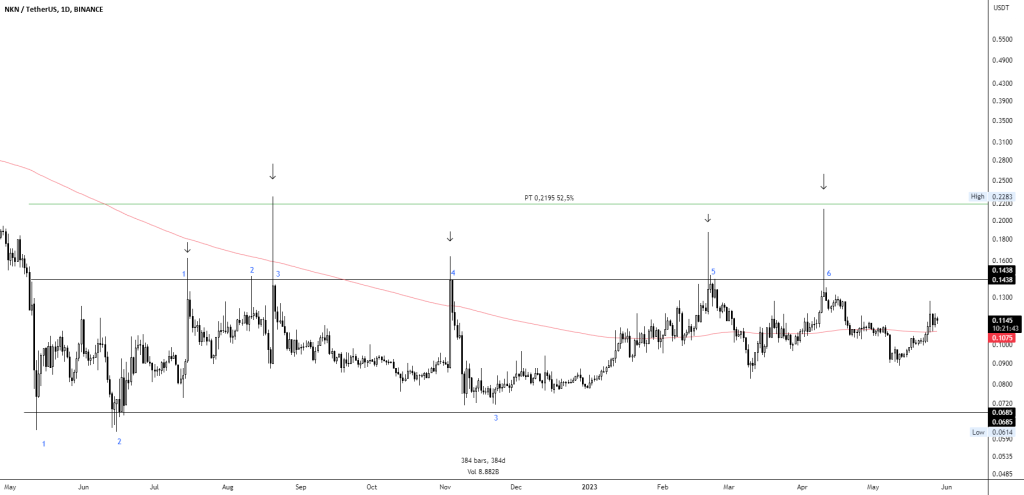
Like many cryptocurrencies, NKN was previously in a downtrend, subsequently transitioning into a consolidation phase. This phase has formed a Rectangle pattern that has been active for over 384 days. The upper boundary of the Rectangle is at $0.1438, marked by 6 touchpoints, while the lower boundary sits at $0.0685, demonstrated by 3 touchpoints.
At present, the price appears to be consolidating above the 200 EMA, signaling a bullish environment. A breakout, confirmed by a candle close above the upper boundary, could present an opportunity to initiate a long position. The anticipated price target would then be at $0.2200, which signifies a potential price increase of 52.5%.
Conclusion:
This technical setup places NKN as a watchlist candidate. However, today’s analysis offers more than just a potential trading setup; it underlines the importance of patience in trading. The marked “spikes” on the chart represent premature breakouts. Those who didn’t wait for a confirmed candle closure would have likely encountered significant losses. This serves as a powerful reminder of the crucial need for patience when trading.
As always, this analysis should be utilized as part of a broader trading strategy, incorporating appropriate risk management. Stay tuned for more cryptocurrency analysis and remember, patience is a virtue in trading.
Happy trading!
Best Regards,
KarimSubhieh


