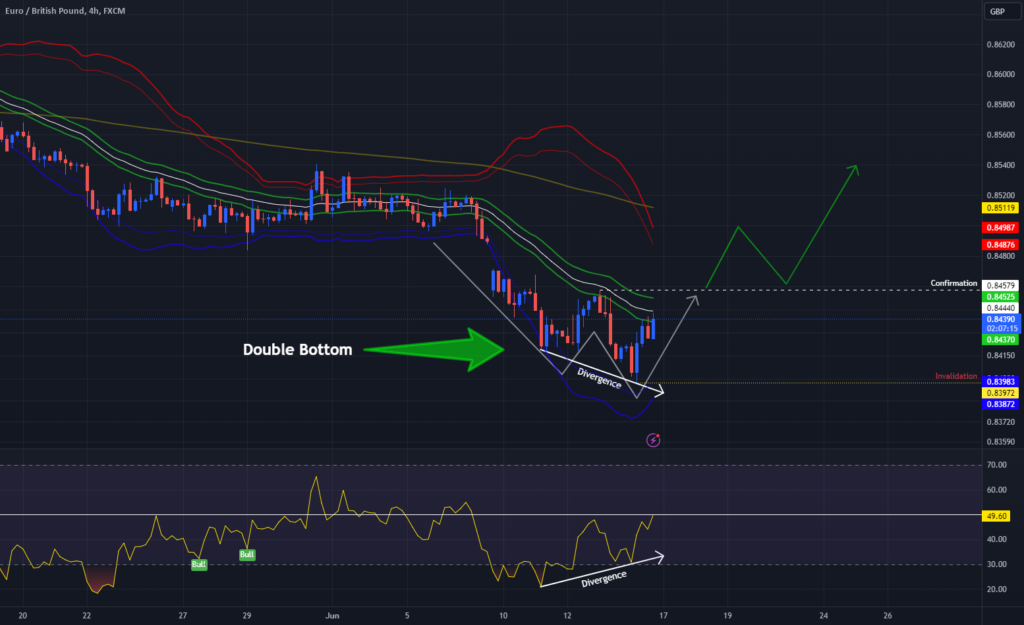
Here I have EUR/GBP on the 4 Hr Chart!
Here we see Price has made 2 clear Lows ( Latter Lower than Previous Low ) with a High @ .84579
-Now to bring attention to the RSI Indicator, we can see Price is showing a different picture ( Latter Higher than Previous Low )
-We also have a Double Tap on the Lower Bollinger Bands
These events add up to what seems to be a Divergence taking place where Price has made its True Low and RSI indicates its no longer looking to go LOWER!!
Now for CONFIRMATION of this Potential Double Bottom Pattern, we NEED Price to Break and Close ABOVE the High @ .84579 and then to Re-test!
INVALIDATION of Pattern will come if Price decides to go Lower than our Low @ .83972


