

https://www.tradingview.com/x/wpkKPE5F/
I got a LONG-trade just now on Cryptocurrency QTUM / USD.
I don’t know much about it but it looks strong on the charts.
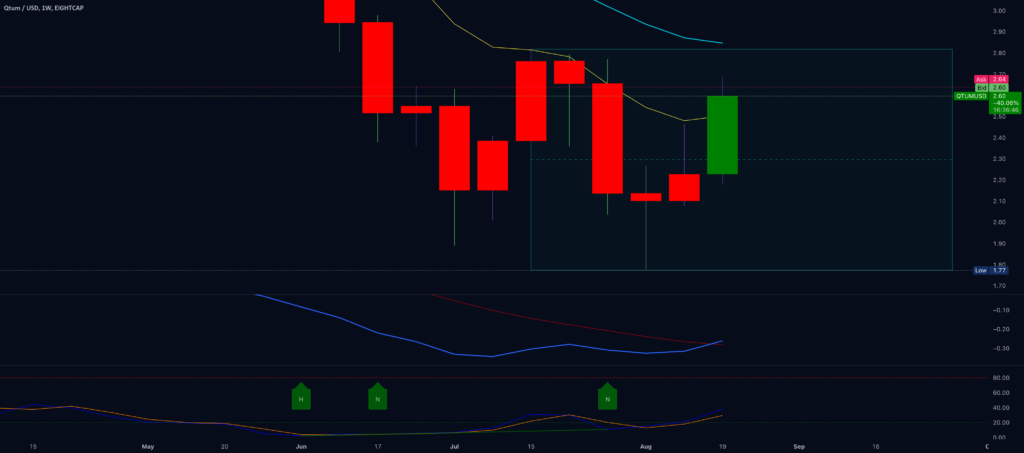
You can see the bullish W/bottom which is well supported with strength underneath current price on the Weekly with very strong Stochastics very over-sold however they are pressing up hard and through the 20 level which is bullish coming out of over-sold on the important Weekly- Stochastic.
Also, see in the Weekly / Chart above the MAC-D bullish cross-up recently.
Both of these things tell me that price is very well supported on this weekly chart to come out of its over-sold condition with plenty of support and strength upwards in price going into the new week.
USD could be weak for a little longer, however I do see the USDX turning around and rallying this coming week, possibly Tuesday / Wednesday.
On the 4HR chart notice the bullish Cup ‘n’ Handle pattern that has formed.
Notice on the Daily Time-Frame here another bullish W-Bottom which has strength because the yellow 9 EMA has recently crossed-up & over the blue 50 EMA & this is very bullish.
Finally, here is the 4HR chart and the Cup ‘n’ Handle pattern I mentioned.
The spread is terrible on some of these buy-sell orders on the little know Cryptocurrency’s so just be aware.
STOP LOSS: Stop at 2.16, which is directly underneath this current bullish candle on the weekly.
Take Profit: 3.86. See chart below.