Article by IG Chief Market Analyst Chris Beauchamp
Dow Jones, Nasdaq 100, Dax 40 Analysis and Charts
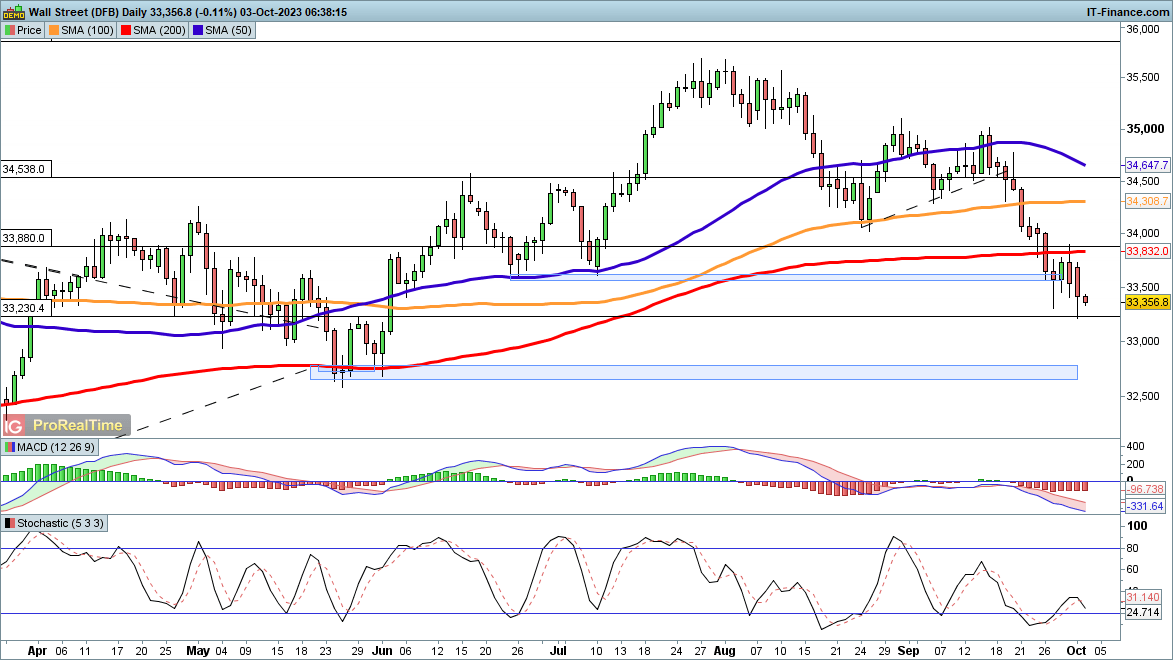
Dow struggles after tough Monday
Losses continued here despite the resolution of the US government’s funding problems.
The index touched a four-month low in Monday’s session and has shown no sign yet of forming a low. Friday’s rejection of the 200-day simple moving average (SMA) provided a fresh bearish catalyst, and for now, further declines seem likely. A drop below 33,230 would mark a new bearish move and open the way to the 32,700 level that was last tested in May.
A rebound above the 200-day SMA might help to suggest that a low has formed for the time being.
Dow Jones Daily Price Chart

Download our Brand New Q4 Equity Forecast
Recommended by IG
Get Your Free Equities Forecast
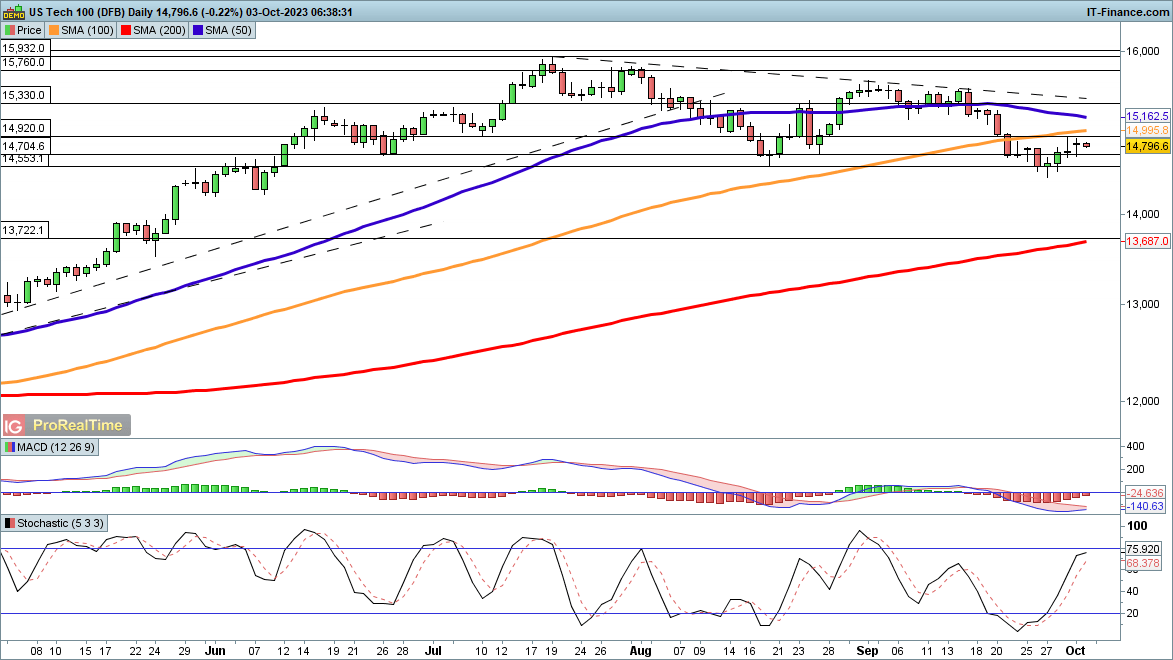
Nasdaq 100 pushes higher
The buyers emerged in this index over the previous three or four sessions, with bargain-hunting helping it to outperform other major US indices on Monday. This may be a sign of risk appetite re-emerging; a close above the 100-day SMA would help to solidify this view, but in the short-term, a rally all the way back above 15,400 is needed to break trendline resistance from the July highs.
A reversal back below 14,700 might suggest the sellers will attempt another move to push the price below last week’s lows when the 14,550 level was staunchly defended.
Nasdaq100 Daily Price Chart

Recommended by IG
Top Trading Lessons
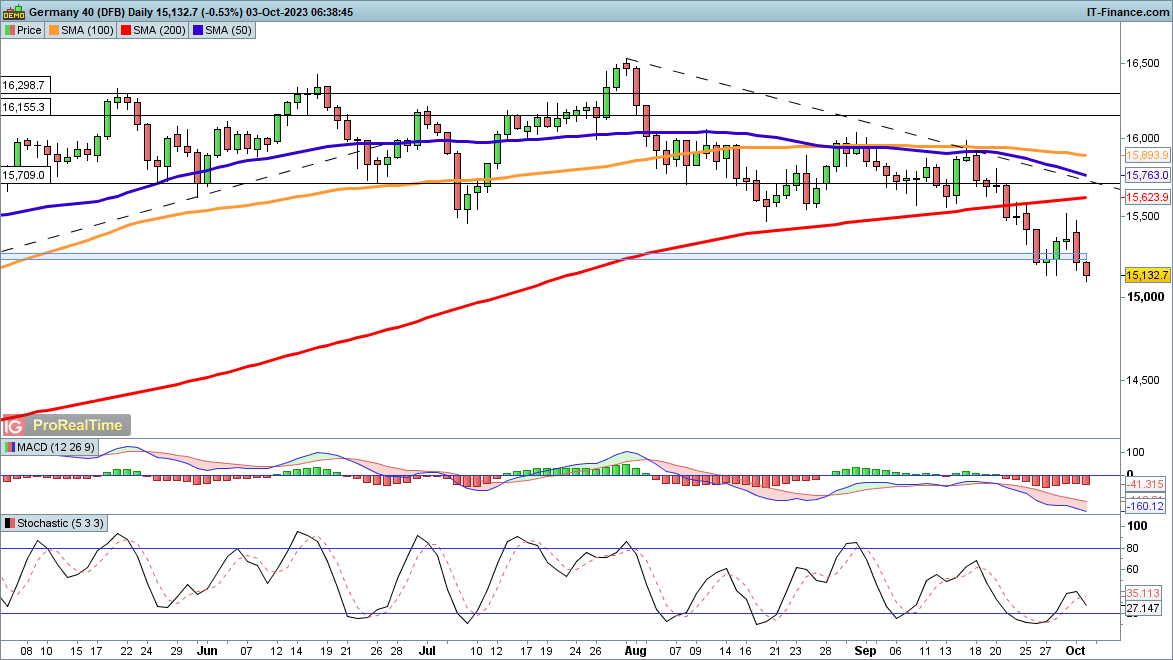
Dax 40 fights to hold near support
The rebound of Thursday and Friday fizzled out on Monday, with the index returning to the 15,200 support zone.It now finds itself balanced right on support, with the March lows around 14,700/14,800 next in view in the event of further losses. Having fallen below support around 15,700 and then 15,500, the sellers remain firmly in control of the index.
In the short term, a close above 15,650 would be needed to pierce trendline resistance from the July record high.
Dax 40 Daily Price Chart

See the Latest IG Sentiment Guide
of clients are net long. of clients are net short.
| Change in | Longs | Shorts | OI |
| Daily | -22% | 3% | -12% |
| Weekly | 5% | -7% | -1% |

