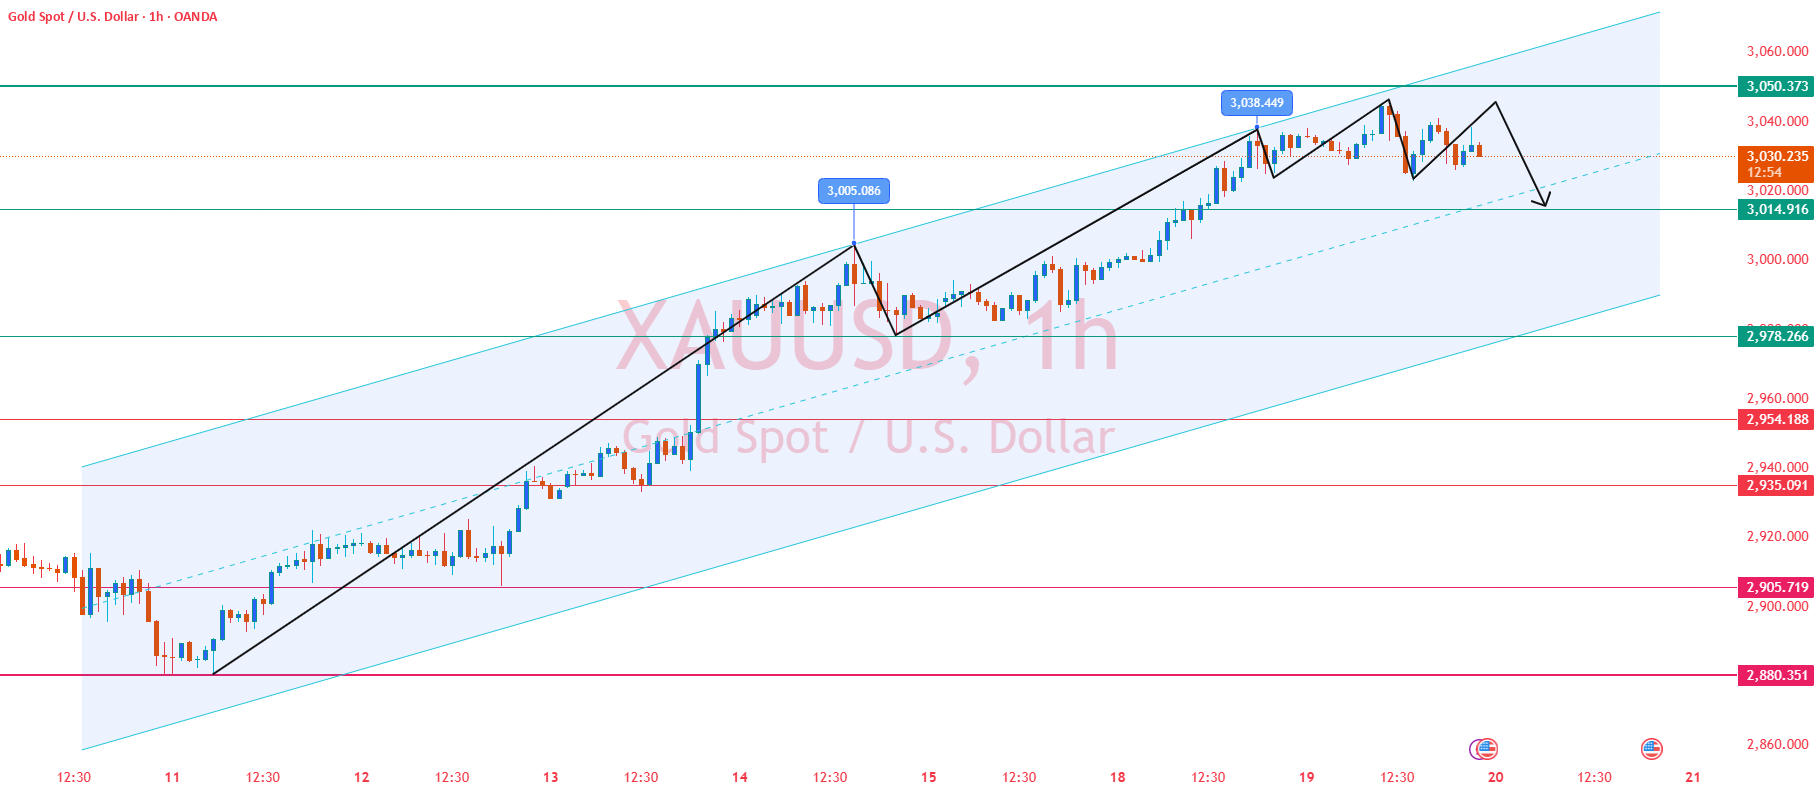
Today, the Asian and European sessions rose to 3045 and then fell back. The US session rebounded to 3040 for the second time but failed to break the previous high, forming a secondary high point suppression, and fluctuated in the 3020-3040 range at the end of the session.
1-hour chart The price is running at the lower edge of the rising channel (3020). If it fails, it will weaken. The reference support below is the 3000 mark.
The 30-minute chart initially shows the prototype of a “head and shoulders top” (left shoulder 3045, head 3040, right shoulder to be determined), the neckline is at 3022, and the pattern is confirmed if it breaks, and the theoretical downward target is 3000-2990.
Fed interest rate decision deduction and strategy
1. Dovish signal (good for gold):
Condition: Powell mentioned the risk of economic recession or maintained the expectation of interest rate cuts in 2024;
🟢Strategy: After breaking through 3050, it will step back to confirm the pursuit of long positions, with a target of 3070-3100; if it falls back quickly after a false breakthrough, short positions on the right will be involved.
2. Hawkish signal (bad for gold):
Condition: The dot plot suggests less than 2 rate cuts this year or downplays inflation concerns;
🟢Strategy: Arrange short orders in the 3040-3050 area, stop loss at 3055, target 3010-3000; if it breaks 3000, increase positions to target 2980.
3. Neutral statement (continued volatility):
Condition: The policy statement is vague and there is no clear guidance;
🟢Strategy: Maintain the 3020-3050 range and buy low and sell high, and stop loss at $5 if it breaks.
The current market situation is in a high-risk state. Trading on your own may result in huge losses. Our professional guidance can help you avoid risks while obtaining continuous and stable profits🤝

