US ISM Services PMI Heads Lower
- Services sector expands but concern over business activity, prices and new orders builds
- Employment softens ahead of Non-farm payroll data for July due tomorrow
Recommended by Richard Snow
Introduction to Forex News Trading
US services PMI eased in July to 52.7, down from June’s 53.9 as business activity, employment and new orders ease, while prices rise.
The services sector is the most influential when it comes to assessing the health of the US economy and therefore, changes in the report’s sub-sections could indicate the future direction of the economy.

Customize and filter live economic data via our DailyFX economic calendar
US Services PMI (ISM)

Source: Tradingeconomics, prepared by Richard Snow
US Fundamental Data Remains Strong Despite Global Growth Slowdown
US (real) GDP growth for Q2 beat estimates of 1.8% by a large margin, revealing a 2.4% rise during the second quarter. With the inflation outlook in the US improving, whispers of a soft landing are reemerging. The services sector remains in expansion despite the overall reading dropping in July, average earnings are strong and the labour market continues to show resilience despite slight signs of easing in recent jobs data. Speaking of jobs data, keep an eye on NFP data tomorrow where the consensus view there is for another 200k jobs to have been added to the economy.
The image below shows the first estimate of US Q2 GDP which leaves the door open to lower revisions but as things stand, US growth heads higher and remains notably stronger than its peers.
US GDP Growth Surprised to the Upside in Q2

Source: TradingView, prepared by Richard Snow
Another measure of how the US economy is tracking, is the Atlanta Fed’s GDPNow forecast tool. The tool is meant to reflect the most immediate data available to the Fed but is only to be analysed as an estimate. Currently the Fed is entertaining Q3 GDP growth in the region of 4% which would represent another substantial rise. The estimate does tend to flatter eventual GDP prints so bear this in mind.
Fed Live Forecast of US Q3 GDP

Source: Atlanta Fed GDPNow, prepared by Richard Snow
Trade Smarter – Sign up for the DailyFX Newsletter
Receive timely and compelling market commentary from the DailyFX team
Subscribe to Newsletter
Immediate market reaction: US Dollar Basket (DXY)
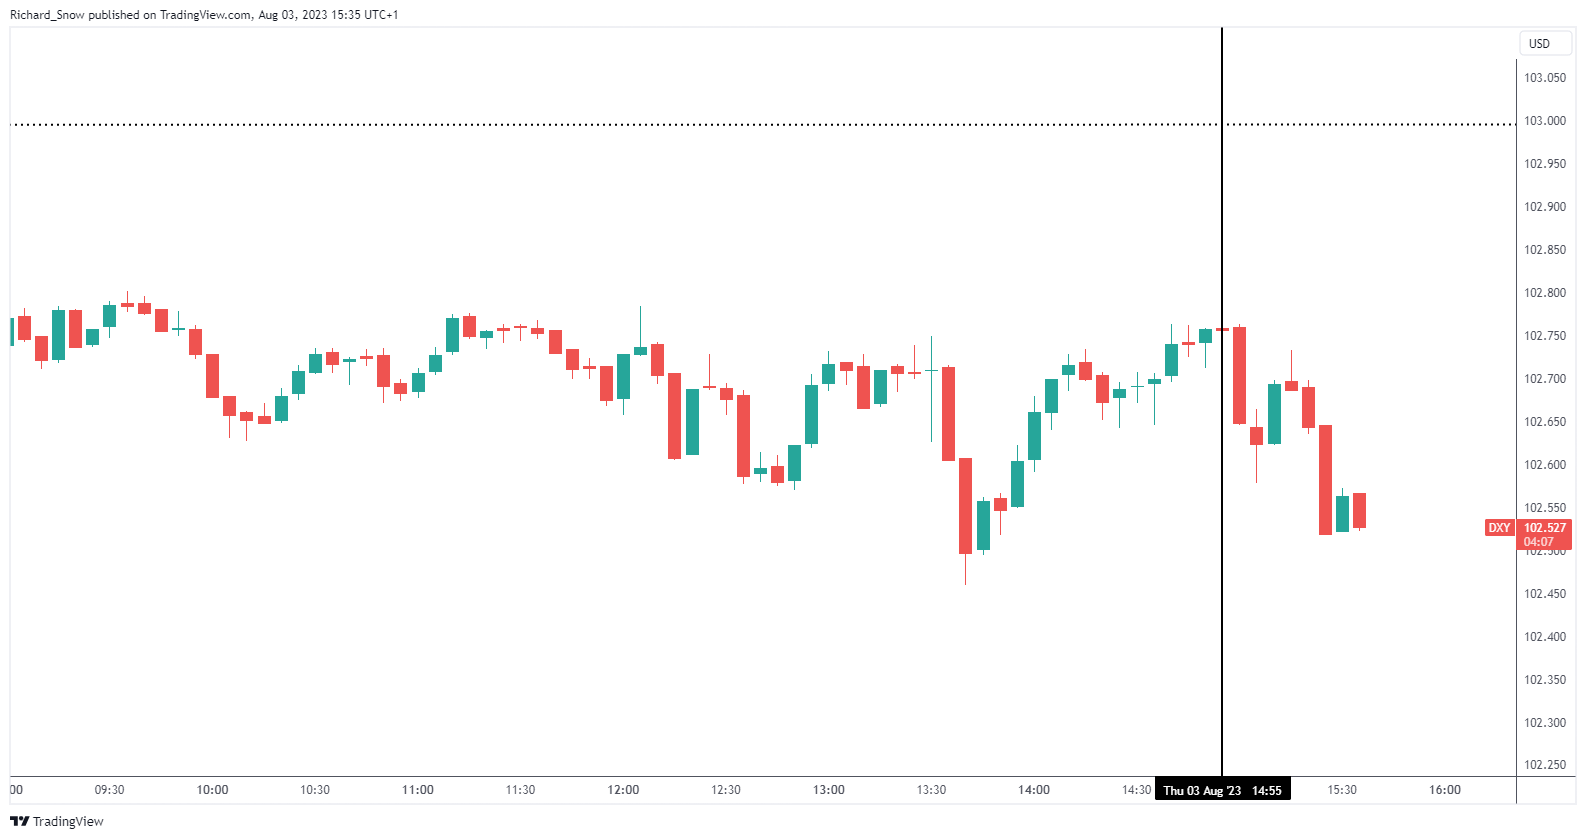
The dollar basket – proxy for USD performance – dropped in the moments after the data was released, seeing the index heading lower for the day thus far
DXY 5-Minute Chart

Source: TradingView, prepared by Richard Snow
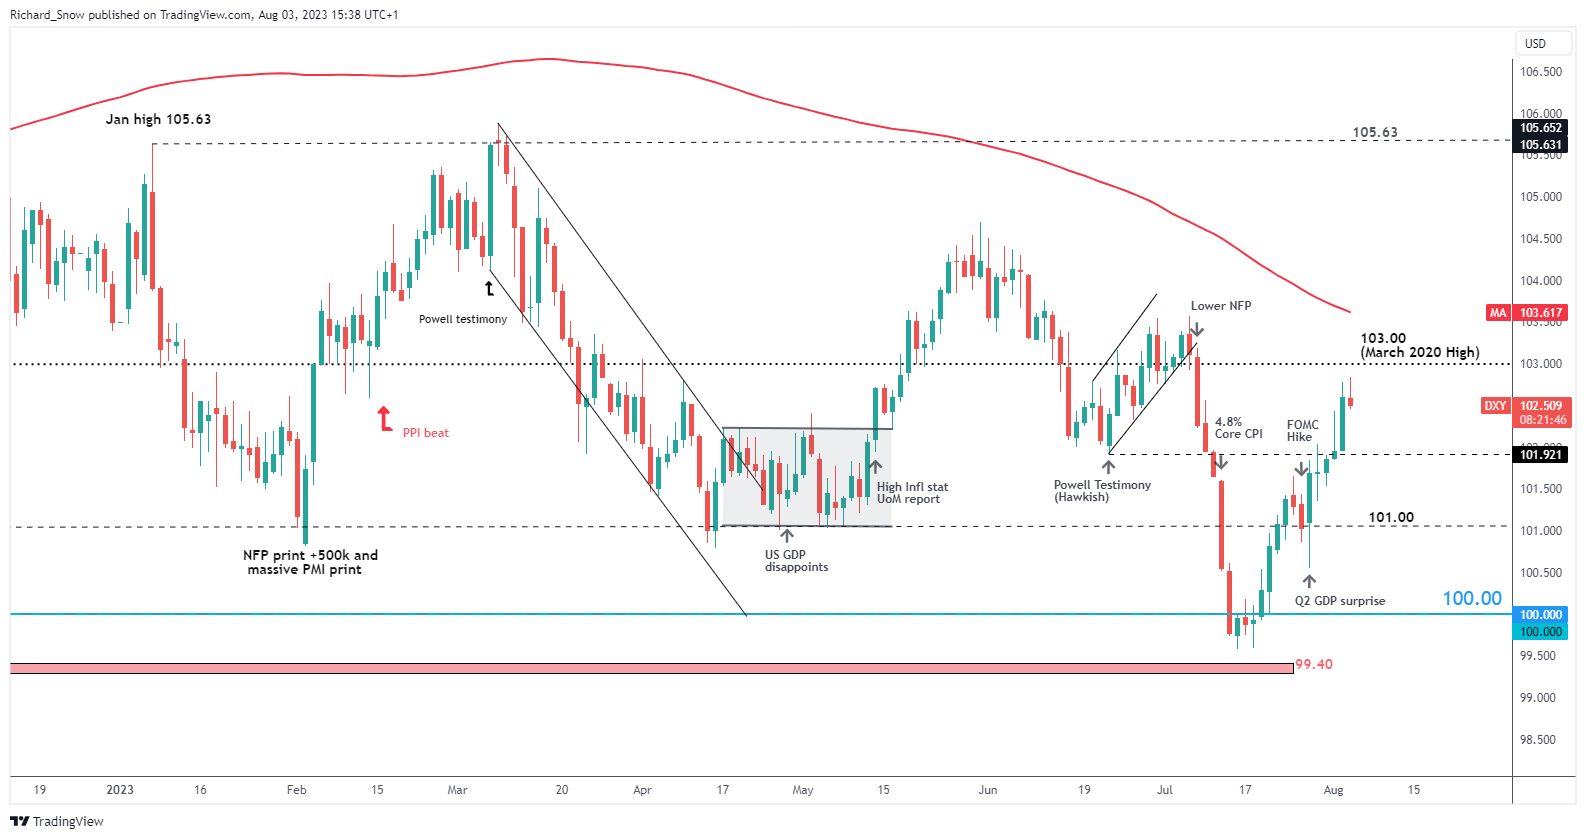
The daily chart shows the recent dollar advance which was largely undeterred by the retracement ahead of the FOMC meeting. The strong Q2 GDP print the very next day helped send the greenback even higher – approaching 103.00 where prices appear to be rejecting higher prices due to the longer upper wicks on the daily charts. Of course, a daily close is needed for better conviction if 103 is to resist higher prices from here.
DXY Daily Chart

Source: TradingView, prepared by Richard Snow
— Written by Richard Snow for DailyFX.com
Contact and follow Richard on Twitter: @RichardSnowFX

