US Crude Oil Price and Analysis
- Bulls have failed at $84 as Beryl downgraded to tropical storm
- Refinery production on the Gulf Coast is reportedly re-starting
- The technical picture is cloudy but may point to further falls
Download our brand new Q3 Oil Technical and Fundamental Forecasts:
Recommended by David Cottle
Get Your Free Oil Forecast
Oil Prices were lower again on Tuesday on reports that Hurricane Beryl left crucial energy architecture in the Gulf of Mexico largely unscathed, easing near-term supply concerns. The area is usually responsible for just under half of all the United States’ oil output. Some production facilities were evacuated as the hurricane approached, leading to a slowdown in refinery activity at coastal sites. However, Beryl weakened after making landfall in Texas and was downgraded to a tropical storm from a Category 1 hurricane. There was relief at major oil shipping docks in the region which either re-opened on Tuesday or were scheduled to do so soon.
A ceasefire in Gaza remains tragically elusive, but efforts to get there continue. That prospect is also helping at the margin to ease worries about Middle Eastern oil supply.
Federal Reserve Chair Jerome Powell will deliver his regular testimony to Congress later. At present the markets suspect, or hope, that US interest rates will at last start to fall in September. For as long as this prospect is live, there will probably be a floor under oil prices as investors anticipate increased energy demand.
US inventory numbers will be closely watched for a repeat of recent, heavy drawdowns.
US Crude Oil Technical Analysis

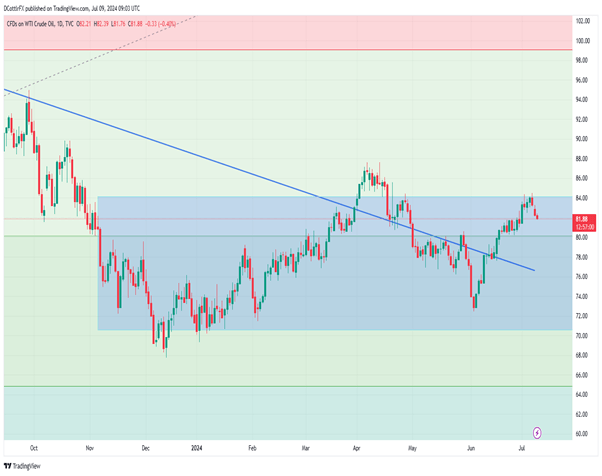
Daily Chart Compiled Using TradingView
Bullish momentum seems to have failed again at what looks like the top of a broad current range, in the $84 region.
It might be too early to count on further falls though. Retracement support at $80.14 remains some way below the market and, for as long as it holds, the bulls might be inclined to push matters again. There is some danger that a ‘head and shoulders’ pattern might be forming on the daily chart. This would suggest that the market has indeed topped and might put the last two months’ strong gains from the $72 region back in doubt.
As we head into Northern Hemisphere summer trading the most likely scenario is probably that the broad range seen since late November last year will hold, or as it has been since, end up being traded back into fairly quickly if escaped. It will likely take a major fundamental shift to see a range break, which in this market will probably mean either a change in the monetary policy outlook, or some left-field news out of major, traditional oil producers.
IG’s own sentiment data underscore this, with traders bullish at current levels, but only very slightly so.
of clients are net long. of clients are net short.
| Change in | Longs | Shorts | OI |
| Daily | 4% | -11% | -2% |
| Weekly | 1% | -14% | -5% |
–By David Cottle for DailyFX

