
VIX, VVIX, S&P 500, Dollar, EURUSD and NFPs Talking Points:
- The Market Perspective: S&P 500 Bullish Above 3,900; EURUSD Short Below 1.0600
- Expected volatility has slipped to extremely low levels according to the VIX and VVIX, which makes benchmarks like the S&P 500 a ‘sitting duck’
- Rate speculation around the Fed swelled this past session between the ADP and Bullard comments, will NFPs spread activity beyond the Dollar?
Recommended by John Kicklighter
Get Your Free Top Trading Opportunities Forecast
We started to see a little more traction on the thematic fundamentals side this past session. Only three full trading days into the New Year, there remains a critical lack of a common beacon for global investors to commit to a clear trend, whether bullish or bearish. That is true of both the S&P 500 which adds another notch to its tight range as well as EURUSD which has seen a few successive and sharp reversals while managing to avoid a clear bearing. We are still seeing the market conditions of a slow reconstitution of liquidity dominating the landscape without a firm speculative wind. Interest rate speculation – particularly the Fed’s – seems to have generated some friction this past session from event risk that could have also painted the picture around growth (read ‘recession’) forecasts. We will see if the NFPs and ISM service sector activity report will add to that skew in interpretation.
Before diving into the market’s thawing attention and the potential with Friday’s top event risk, it is worth evaluating the current environment – because it is extreme. While we are still at the dawn of restoring liquidity after holiday conditions, I think it is still fair to say that expected volatility through the traditional measures that I monitor are extreme. The VIX volatility index is low in the range that it established through 2022, but the traditional ‘fear’ gauge is far from historical extremes that pushed the 10 handle back in the summer of 2017. Instead, my interest is in the VVIX, the so-called ‘volatility of volatility’ index. This is a measure of potential for activity levels to suddenly change, and the current reading is the lowest seen since July 2019 and more broadly at range lows stretching back to July 2014. That’s far too complacent. Add to that the SKEW (or ‘tail’) index is scouting its series lows once again, and there are issues at hand.
Chart of the VVIX Volatility of Volatility Index Overlaid with the VIX (Weekly)
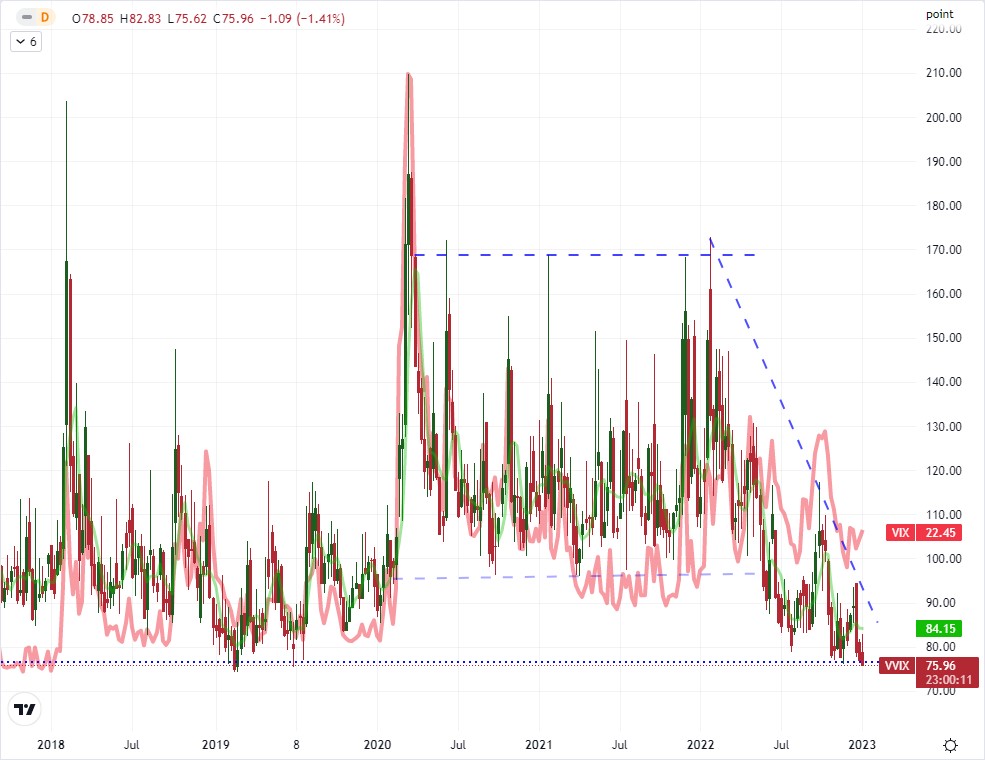
Chart Created on Tradingview Platform
Looking at the US indices, the wind up in low volatility looks particularly threatening compared to their technical congestion. For the S&P 500, the count on the obstinate 3.1 percent range is now up to 13 straight trading days. That is the narrowest trading corridor for this index since November 2021 (that historical reference will hold for another few days). Purely from a technical position, a break from this pair could occur in either direction without raising discussion of full commitment. Breaking above the 100-day simple moving average at 3,890 would still find range up to the 4,050/4,100. Conversely, a break below 3,775 has run in the past three months’ range all the way down to 3,500. That same balance is not the same for the other major indices. The Dow is near the top end of its own range with a break below 32,600 likely more productive. Meanwhile, if the Nasdaq 100 were to make a significant bearish punch, a break below 10,500 would put the index in a position of plumbing fresh two-and-a-half year lows. Of course, direction depends on the event risk ahead.
Chart of the S&P 500 with Volume, 13-Day Range and ATR (Daily)
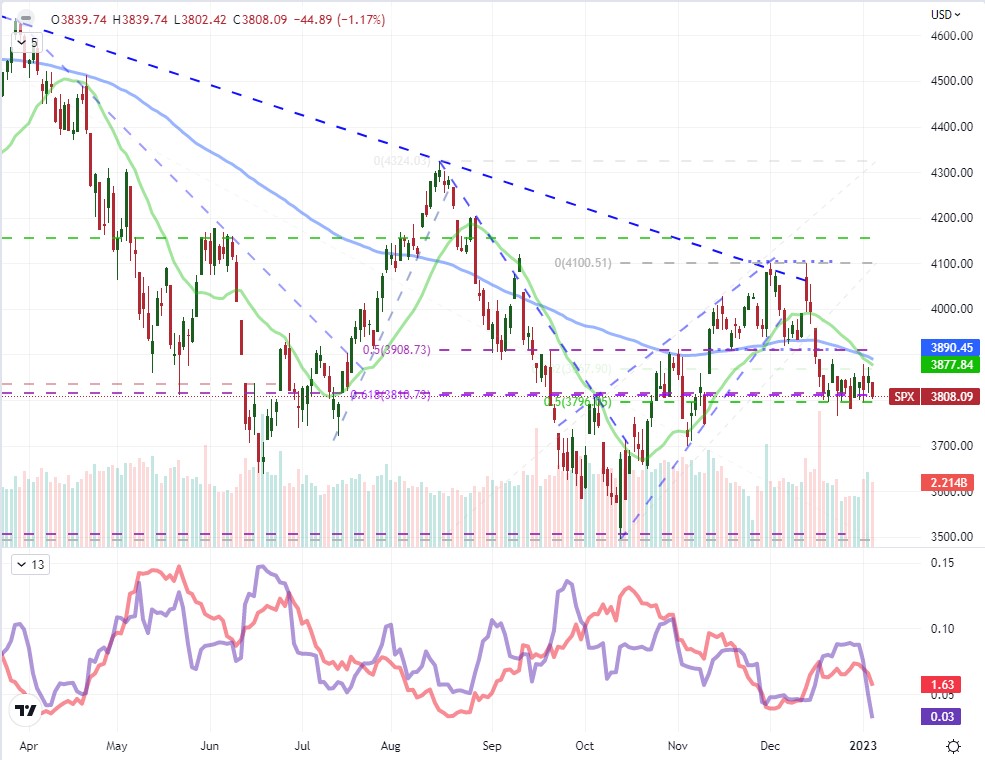
Chart Created on Tradingview Platform
From a fundamental perspective, rate speculation seems as if it is the most capable systemic theme. This frequent source of market provocation in 2022 generated a serious response from the US Dollar this past session. The Greenback surged following the release of the ADP private payrolls report. The pre-NFPs figure beat expectations handily with a net 235,000 position increase compared to the 150,000 rise expected. This could have been read as a benefit to the US economy in combatting tighter financial conditions; but it seemed that the implications for a slightly more hawkish FOMC path moving forward carried more weight. The DXY Index managed to clear its multi-week range with a bullish break which translated into a EURUSD drop that maintained the 20-day SMA as resistance and return the market to its lowest level in multiple weeks. With lower lows, this looks more productive as a turn; but the event risk ahead will play a critical role in determining that next move.
of clients are net long. of clients are net short.
| Change in | Longs | Shorts | OI |
| Daily | -7% | 0% | -3% |
| Weekly | 15% | -7% | 1% |
Chart of the EURUSD with 20-Day SMA Overlaid with Inverted Implied June Fed Funds Rate (Daily)
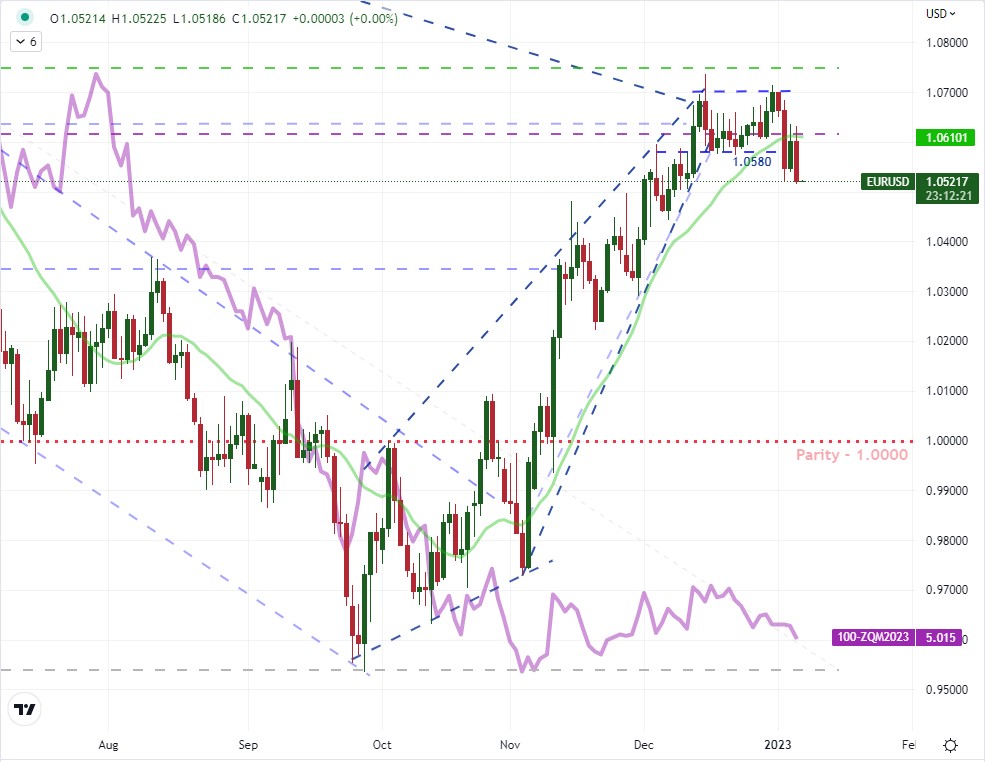
Chart Created on Tradingview Platform
Focusing in on the December nonfarm payrolls (NFPs) ahead, we need to consider the context of the backdrop as well as the particulars of this month’s release. The economists’ consensus for this report is for a 200,000 net increase (the third month in a row we’ve seen this exact projection) which sets the baseline. The ADP release bested that projection which is likely why the markets reacted so abruptly (at least the Dollar and yields). This labor report can cater to two possible themes: the outlook for economic activity or the forecasted terminal rate from the Fed. This will be the first fundamental point to register, but which theme we draw momentum from will likely spill over into the session’s other top fundamental listing: the ISM service sector activity report. If the jobs figures are strong, it will likely translate into higher interest rate forecasts; which will be difficult to shake for capital market benchmarks like the S&P 500. A strong NFPs and strong services report will amplify the rate hike signal while a strong labor report and weak ISM will likely compound ‘risk assets’ troubles. If the jobs report disappoints, it could offer some rate hike relief; but in that scenario a weak ISM will likely find the bears trigger point and translate into safe haven appetite for the Dollar.
Chart of Change in NFPs, Change in ADP and Difference Between the Two (Monthly)
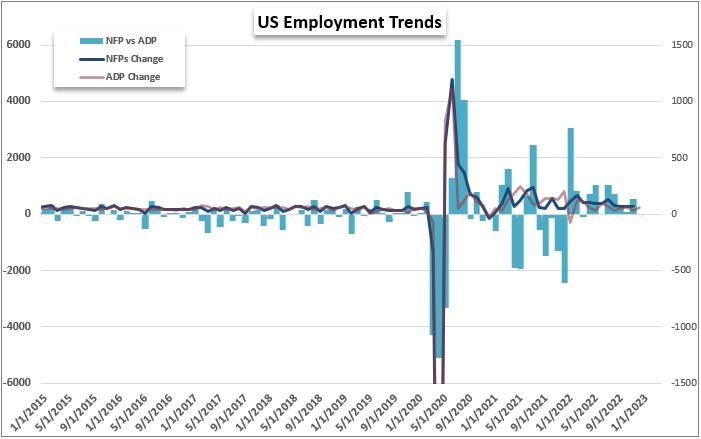
Chart Created by John Kicklighter
While the US combo of the NFPs and service sector activity is my top concern for Friday, it isn’t the only significant event risk on tap. For the US, there will be a run of Fed speakers on tap closer to the end of liquidity for the day – though watch out for unscheduled remarks through the day. Another country/currency that will digest high-impact employment data will be Canada/Loonie. The December labor statistics for Canada project a very modest 8,000 job increase. That leaves plenty of room for surprise. For full scope fundamental impact, the Eurozone/Euro will hit a number of key points. Eurozone CPI, consumer inflation expectations, sentiment surveys and retail sales covers a very wide range picture. That said, there won’t be a lot of time before the weekend liquidity drain to turn event risk into price action.
Top Macro Economic Event Risk Through Week’s End
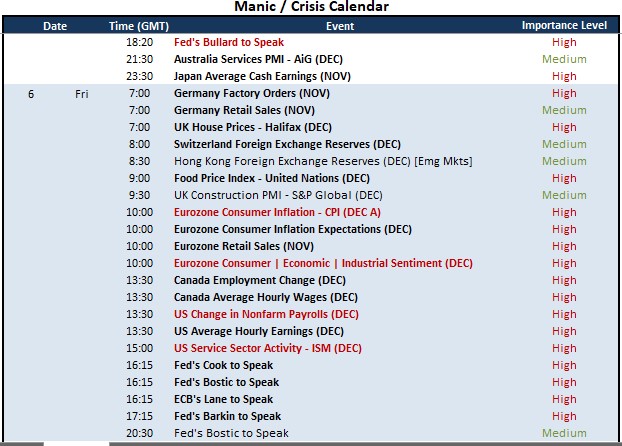
Calendar Created by John Kicklighter

Discover what kind of forex trader you are

