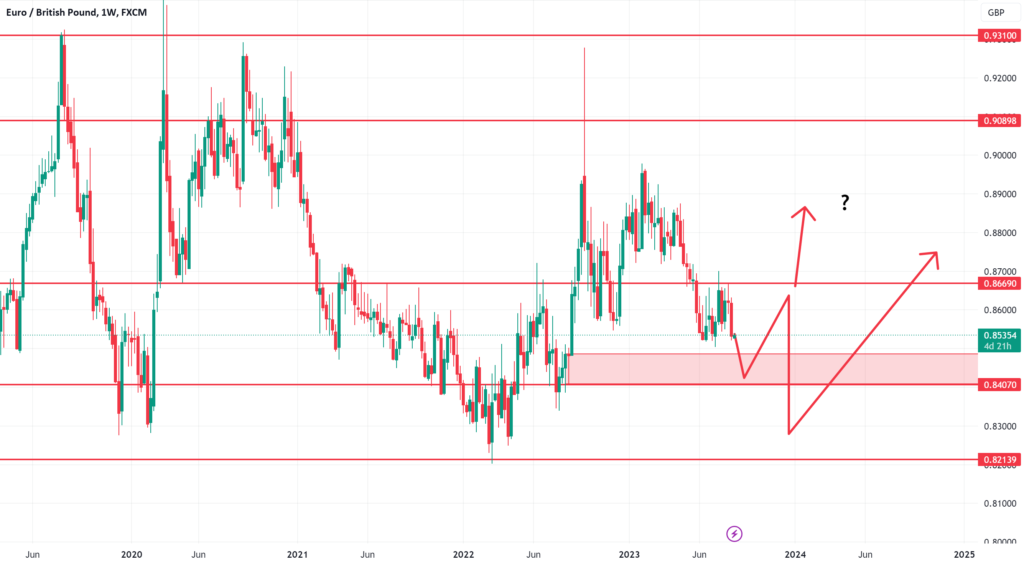
This pair is currently locked within a long-term range on the Monthly charts, spanning from 0.82 to 0.92. Our current path is leading us downwards, inching closer to the lower boundary of this range, which is setting the stage for nice buying opportunities.
We a Weekly BUY/DEMAND zone that was created in Aug last Year, starting at 0.845. Additionally, a weekly resistance level is identified at 0.84. Zooming into the daily charts we can see the target areas more clearly see image below

I will be waiting for a signal on the TRFX indicator within the 4-hour to 8-hour timeframes as we approach the 0.845 and go below. Stop loss will depend on the entry price of the trade.
As for target for this concept, the first target will be at the 0.865 resistance level. This area might also present an interesting opportunity for more selling as its a nice resistance area and will be the newly created Weekly SUPPLY/SELL area if we break 0.85, if selling comes in here again then we will likley be heading towards 0.82 bottom of range.
Should price successfully break the 0.865 resistance , then a climb towards 0.885 is on the cards . Then focus might shift towards the top of the range.
I will keep you posted on the idea as it progresses
Hope you enjoyed the read!


