

Hello traders and investors!
I reviewed the assets and highlighted silver as an interesting opportunity for trades next week. For example, in gold, on the daily timeframe, the price has broken out of a range, and it’s hard to predict how far it will go. In silver, the targets are clearer.
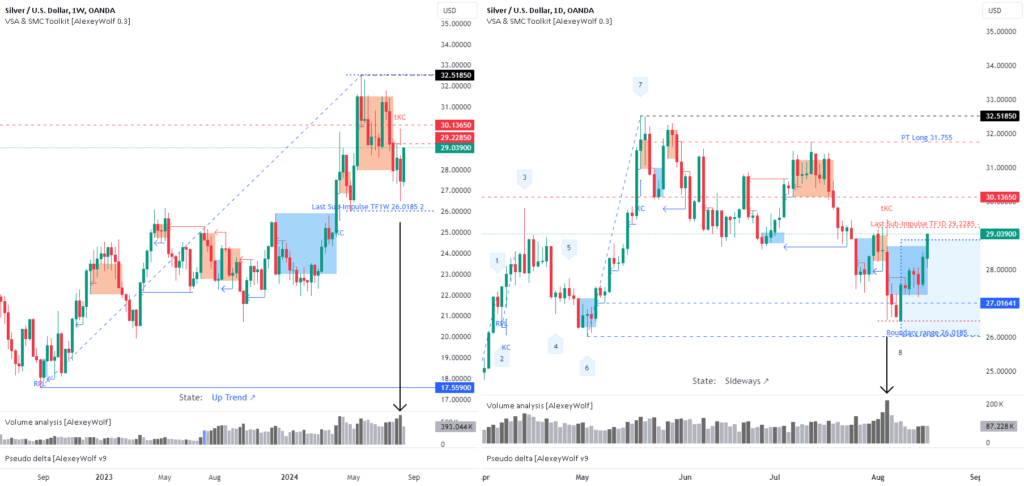
Weekly Timeframe
On the weekly timeframe, there’s a bullish trend. The last upward impulse started from the 17.559 level. The most recent sub-impulse within that impulse began at the 26.0185 level. At the end of the impulse, a seller’s zone formed after the seller absorbed a buyer’s candle with growing volume, which has already been tested by the buyer—the test level is 29.2285 (seller’s zone marked by a red rectangle on the chart). The seller’s candle at the test level had the highest volume in a year, but the result was just a shadow: the body of the candle couldn’t close below the shadow of the previous candle. The latest weekly candle, with falling volume, absorbed the seller’s candle. This indicates that although the seller tried to resume the downward movement from their zone, they have been unsuccessful so far.
Daily Timeframe
On the daily timeframe, the price has formed a range that began in April. The upper boundary is 32.5185, and the lower boundary is 26.0185.
The seller’s 7-8 impulse has played out, and now the buyer’s 8-9 impulse is active, with a potential target of 31.755. A buyer’s zone has formed at the base of the new 8-9 buyer’s impulse after the buyer absorbed the seller’s candle from August 5th, which had growing volume (buyer’s zone marked by a blue rectangle on the chart). Note the volume of the seller’s candle from August 5th—it’s the highest in several months.
Thus, on both the weekly and daily timeframes, the priority is on buying.
There are obstacles on the buyer’s path that need to be monitored. The first obstacle is the start of the last sub-impulse in the seller’s 7-8 impulse (29.2285), and the second obstacle is the previous weekly high (30.1365), where a seller’s zone has also formed.
Buying Strategy
For trade setups, you could consider the 4-hour timeframe. On this timeframe, the price has formed a range with an upper boundary of 29.2285 and a lower boundary of 26.4710.
You could, for example, look for buying opportunities from the buyer’s defense of the lower boundary of the range or after a breakout to the upside and the buyer’s defense of that breakout.