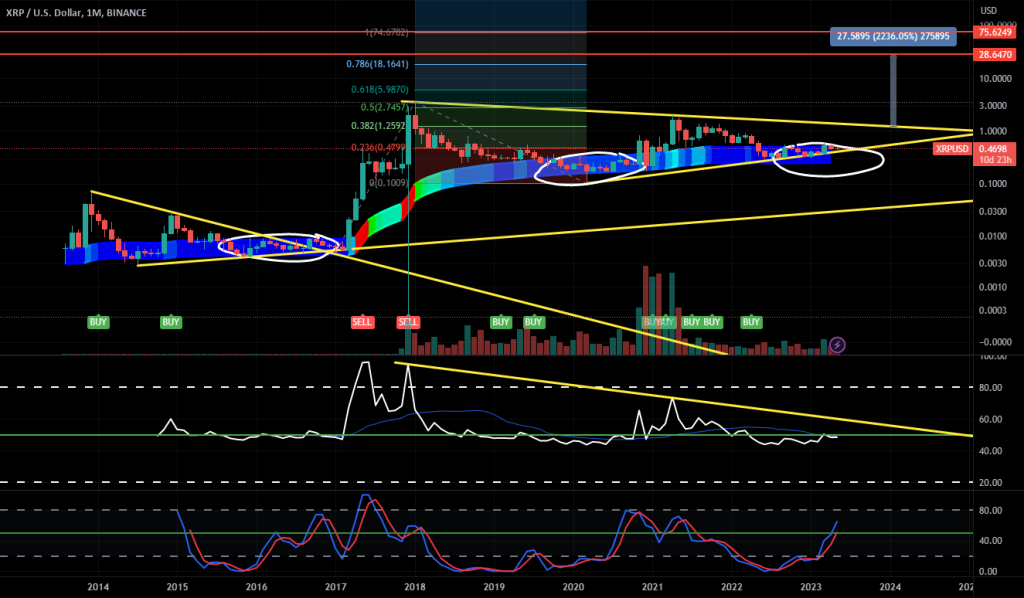
This is the monthly chart on XRP and making an attempt to estimate a long-term target IF the long term pennant that we are currently testing the lower trend line eventually break bullish. Below are the factors.
1) Steves HeatWorm is in the buy zone. We can notice that the last 2 times we were in the buy zone of this indicator marked with white circles and denoted in dark blue have historically indicated a great accumulation zone.
2) XRP have been for many years in the top projects and the monthly chart show a great price structure holding the price. One thing to note is the last bull cycle did not made a higher high in reference to 3.66$.
3) if ever we break to the upside the current pennant and if the RSI break its long term down trend line market in white one would hope that the first price target would be a measured move of the pennant at around 28$. also, the fib 100% extension target a price of 75$ marking a potential second target for the very long term.


