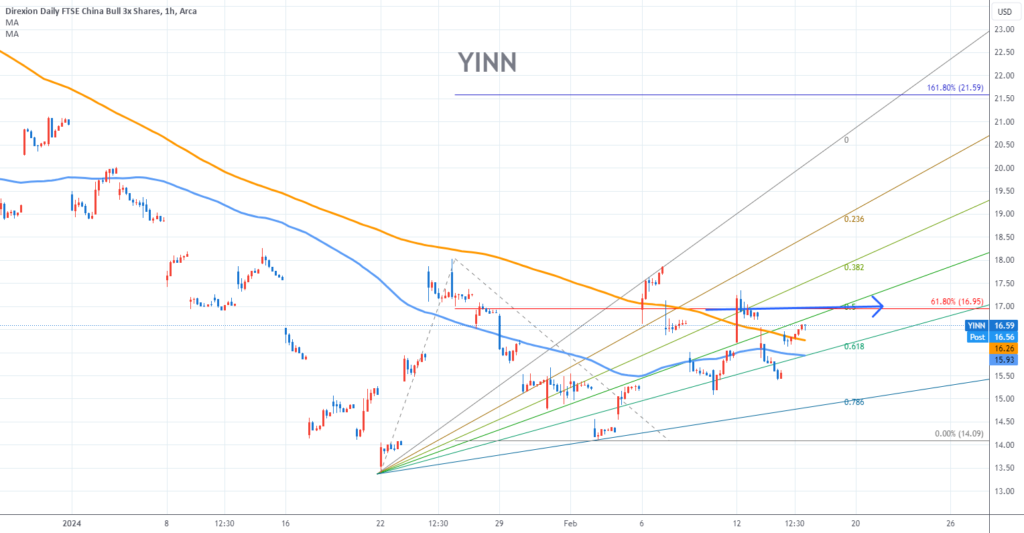
Trading Idea 1) Find a FIBO slingshot 2) Check FIBO 61.80% level 3) Entry Point > 17/61.80% Chart time frame : B A) 15 min(1W-3M) B) 1 hr(3M-6M) C) 4 hr(6M-1year) D) 1 day(1-3years) Stock progress : B A) Keep rising over 61.80% resistance B) 61.80% resistance C) Hit the bottom D) Hit the top Stocks rise as they rise from support and fall from resistance. Our goal is to find a low support point and enter. It can be referred to as buying at the pullback point. The pullback point can be …

YINN Stock Chart Fibonacci Analysis 021424 for AMEX:YINN by fibonacci6180
Trading Idea 1) Find a FIBO slingshot 2) Check FIBO 61.80% level 3) Entry Point > 17/61.80% Chart time frame : B A) 15 min(1W-3M) B) 1 hr(3M-6M) C) 4 hr(6M-1year) D) 1 day(1-3years) Stock progress : B A) Keep rising over 61.80% resistance B) 61.80% resistance C) Hit the bottom D) Hit the top…
Shares:

