

Dow, S&P 500, Volatility, EURUSD and Fed Rates Talking Points:
- The Market Perspective: S&P 500 Bearish Below 3,800; USDCNH Bearish Below 7.0000
- While there was notable event risk for release Monday – such as the NY Fed’s inflation expectations – it seemed markets were motivated more by Friday’s momentum
- A false breakout reversal from the S&P 500 and sustained advance from the EURUSD opens significant macro questions for Tuesday trade and beyond
Recommended by John Kicklighter
Get Your Free Top Trading Opportunities Forecast
The market’s penchant for volatility but struggle for conviction last week seems to have carried over to this new period. We are no doubt still trying to shake off the cobwebs of the liquidity swoon associated to holiday trading conditions and the subsequent ‘return to normality’. Yet, critical in grounding some of this errant speculation in a viable systemic theme that can rouse the masses to a common banner. Whether that be a fundamental theme such as an easing of the global monetary policy regime, fear of an impending recession or simply a collective view behind sentiment; a unified driver would be the most effective source of anchorage. In the absence of that guiding light, volatility will continue to churn without the satisfaction of progress. We continued to see that frustration this past session among the major US indices. The blue-chip Dow Jones Industrial Average charged higher on the open to further upend the head-and-shoulders pattern that we triggered back on December 15th, but ultimately closed back below the ‘neckline’ around 33,500 by the close. The reversal ‘false break reversal’ pattern was even more consequence for the S&P 500 which opened the week to a gap higher that cleared the midpoint of the August to October bear leg at 3,909. Yet, sharp reversal intraday would pull us right back below that technical threshold and leave us with the largest ‘upper wick’ since November 2nd.
Chart of the S&P 500 with Volume and 100-Day SMA (Daily)
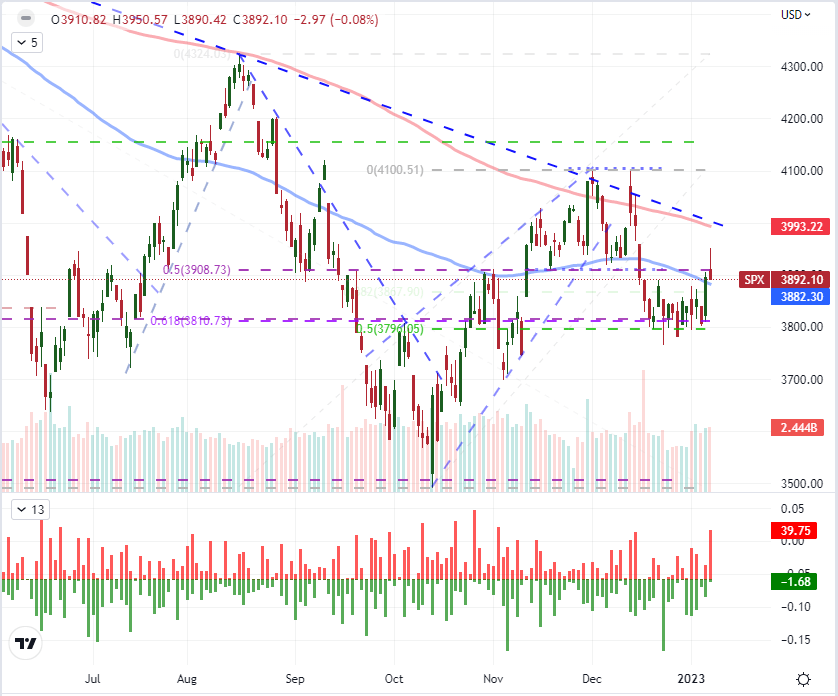
Chart Created on Tradingview Platform
The rally component of the US indices seems to mirror directly risk appetite registered for many assets. Global equities, emerging market assets, junk bonds, carry trade and commodities with a risk bent all similarly enjoyed the buoyancy. However, whether or not the market retreated or not depends on when the given market closed. For example, international indices such as the German DAX 40, UK’s FTSE 100 or Hong Kong Heng Seng followed the same initial rally but didn’t retreat into the close. In contrast, the EEM ETF, HYG ETF and Yen based carry trades all experienced the same retreat as the major US tickers. That suggests that sentiment soured during the US session – though it is still an influence with some global traction. For volatility, I would point out that the intraday reversal in the US session managed to inflate the ‘volatility of volatility’ VVIX index back above the 76 handle which represents the start of the lower threshold back to 2014. It’s a long way to normalize this ‘expected volatility’ measure, but that was one step in that direction.
Chart of the VVIX Volatility of Volatility Index Overlaid with the VIX (Weekly)
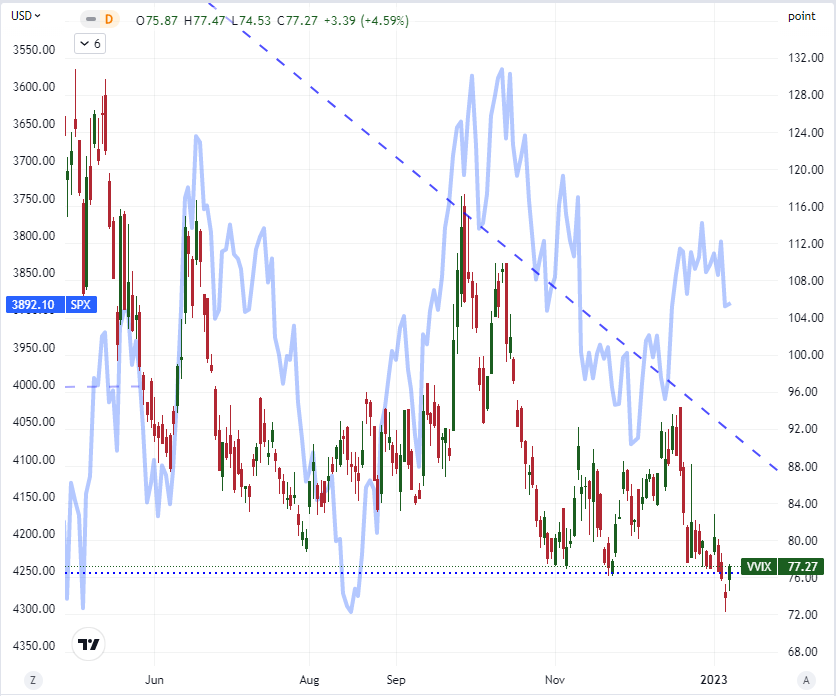
Chart Created on Tradingview Platform
For a fundamental theme, there remains limited option for a clear driver for the speculative masses. It takes large ranging influence with serious consequence to rouse the global markets. And, while we are seeing some modest adjustments to some systemic matters, we simply do not have the full traction on these means just yet. On the recession front (the theme that I feel has the most potential and is least priced in), the warning that we were delivered in the ISM service sector activity report this past Friday seems to have all but fallen into the background. This is true of most of the problematic reads that we have had over the past months whether it be the 2-10 spread, central bank warnings, sentiment surveys, etc. It isn’t that these measures aren’t important and will not exact a toll. We just are awaiting the market’s readiness to digest these issues. In the meantime, the nuance between Fed rate speculation continued to play out like an active spectator sport whereby we record every basis point shift. The New York Fed’s Consumer Inflation Expectation survey for December was released with a 0.2 percentage point drop to 5.0 percent outlook for 1-year forward. If that were the CPI, we may have seen a bigger market response; but even then, the official inflation report has been uneven in establishing follow through – something we will have to consider for Thursday.
Chart of US 2-Year Treasury Yield Overlaid with US CPI and NY Fed Inf Expectation (Monthly)
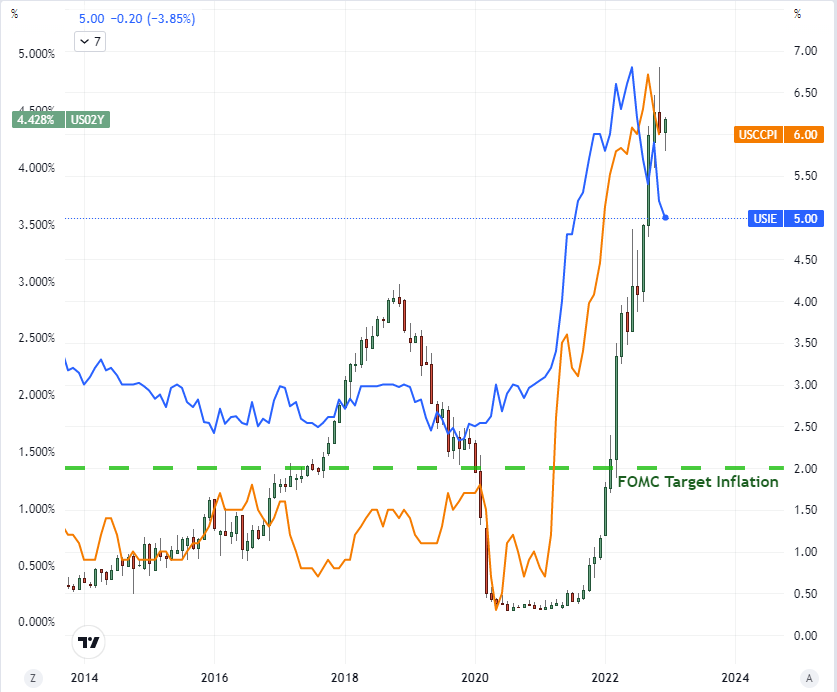
Chart Created on Tradingview Platform
While inflation expectations have yet to significantly shift, we would nevertheless see the Dollar held onto its own losses through the day. The DXY trade-weighted Dollar Index extended Friday’s false bullish breakout reversal to extend its slide to fresh six month lows. At the 103 level, we have some technical precedence in the March 2020 swing highs. I don’t think the level itself for this index counts as much as the momentum the bears need to generate from the fundamental backdrop. If you look to many of the USD-based majors, there is material technical overheard that can trip up a productive bearish run. GBPUSD, NZDUSD and USDCAD all have imminent chop from recent history to trip up momentum. EURUSD is perhaps among the best positioned for clearance, but here too, the break looks a lot like the tentative period the S&P 500 registered before it fell back to earth.
of clients are net long. of clients are net short.
| Change in | Longs | Shorts | OI |
| Daily | -21% | 10% | -8% |
| Weekly | 0% | 1% | 0% |
Chart of EURUSD with 50-Day SMA and COT Net Speculative Futures Positioning (Daily)
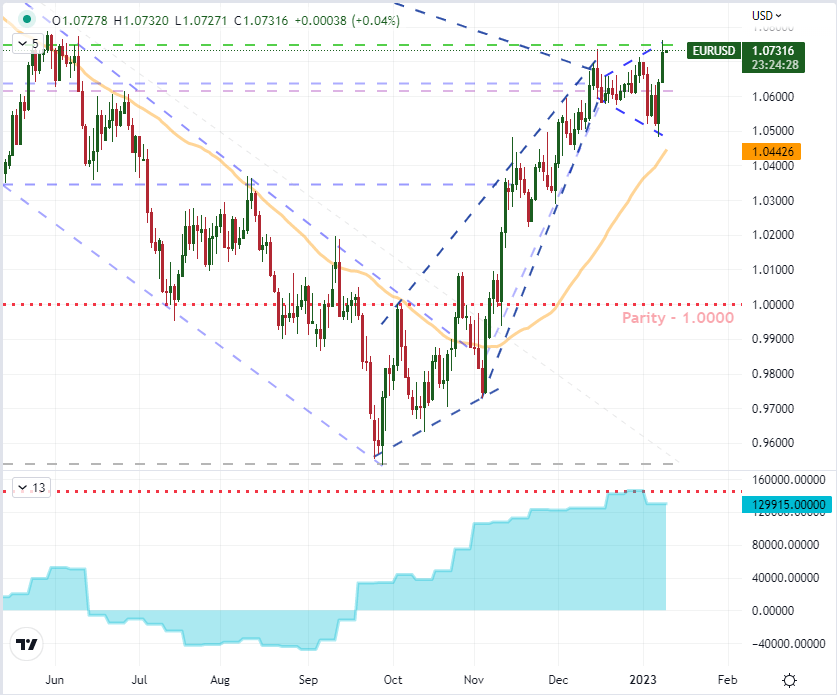
Chart Created on Tradingview Platform
Keeping a track on what can actually motivate us to genuine traction. The next 48 hours are not particularly convincing. If anything Tuesday’s trading session has event risk that I believe carries more potential than what we had Monday – at least for the US side. For Europe, this past session’s unemployment rate hitting a record low for the Eurozone leverages the pressure on the ECB to continue its quest to cap inflation. But for the Dollar, Fed Chairman Jerome Powell’s remarks can prove far weightier with markets than the NY Fed’s expectations survey. I will also be watching the NFIB business confidence and IBD’s economic optimism surveys for recession insights, but earnings is this week’s top lift on that theme.
Top Macro Economic Event Risk Next Week
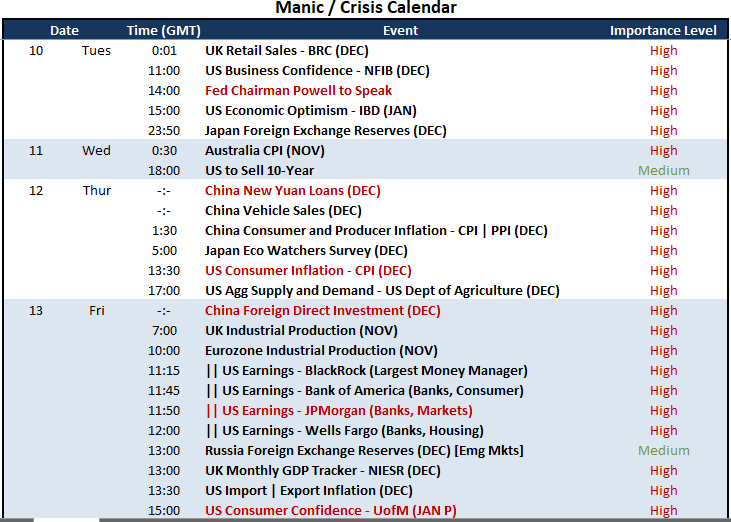
Calendar Created by John Kicklighter