
Hong Kong’s Hang Seng Index leapt higher after Chinese PMI readings were much better than expected amid hopes that the world’s second-largest economy might stoke global growth.
Hang Seng Index, HSI, China PMI, AU GDP, JP PMI, Caixin, NPC – Talking Points
- The Hang Seng Index jumped on improving business confidence
- The PMI readings were consistently higher across different segments
- Currencies and APAC equities were quiet. Will a rally in HSI lift sentiment?
Trade Smarter – Sign up for the DailyFX Newsletter
Receive timely and compelling market commentary from the DailyFX team
Subscribe to Newsletter
Hong Kong’s Hang Seng Index (HSI) broke the spell of bearishness today after a series of Chinese PMI numbers came in much better than expected.
Mainland Chinese indices also gained but to a lesser extent. The rest of APAC equities have had a quiet day so far as have most currency pairs.
The US Dollar is marginally weaker despite another uptick of a couple of basis points across the Treasury yield curve.
Chinese manufacturing PMI for February was 52.6, which beat forecasts of 50.6 and 50.1 previously. This is the highest result since April 2012. Non-manufacturing PMI was 56.3 rather the 54.9 estimated and the composite PMI was 56.4 against 52.9 prior.
The Caixin manufacturing PMI, a survey of smaller Chinese firms, also registered a solid beat of 51.6 instead of the 50.7 anticipated.
After losing 9.9% in February, today’s run-up of over 3.5% presented a welcome relief for Hang Seng bulls ahead of the Nation People’s Congress that is due to begin this weekend.
There are hopes for the announcement of several initiatives to promote growth in the Middle Kingdon. The Chinese Renminbi posted small gains on the data.
Elsewhere, Australian 4Q quarter-on-quarter GDP came in at 0.5% rather than the 0.8% forecast and against the previous 0.7% that was revised up from 0.6%.
Annual GDP to the end of December was 2.7% as anticipated revealing more upward revisions to prior quarters. The prior read was 5.9%. AUD/USD initially dipped below 67 cents but recovered after the Chinese PMI data.
Jibun Bank Japan manufacturing PMI was also released today, coming in at 47.7 against 47.4. USD/JPY and the Nikkei 225 were little changed.
Wall Street finished slightly lower, and futures are indicating an opening to the cash session to be close to where they left it.
Gold and crude oil have got a small boost again from the easing of the US Dollar in the Asian session.
Looking ahead, the data map today is quite congested with several CPI and PMI readings alongside US manufacturing ISM data. There will also be plenty of speakers from the ECB, BoE and the Fed to markets twitchy.
The full economic calendar can be viewed here.
Recommended by Daniel McCarthy
Traits of Successful Traders
Hang Seng Index (HSI) TECHNICAL ANALYSIS
The Hang Seng roared higher today as it approached the 10-day simple moving average (SMA) A break above it might indicate that some short-term bullishness may evolve.
The bounce comes after it was unable to penetrate below the 200-day SMA and that could continue to provide support near the recent low of 19664.
Further, support may lie at the prior lows of 19338 and 18917. The 100-day SMA is near the latter and might lend support.
On the topside, resistance could be near the 21- and 55-day SMAs in the 20750 – 20930 area.
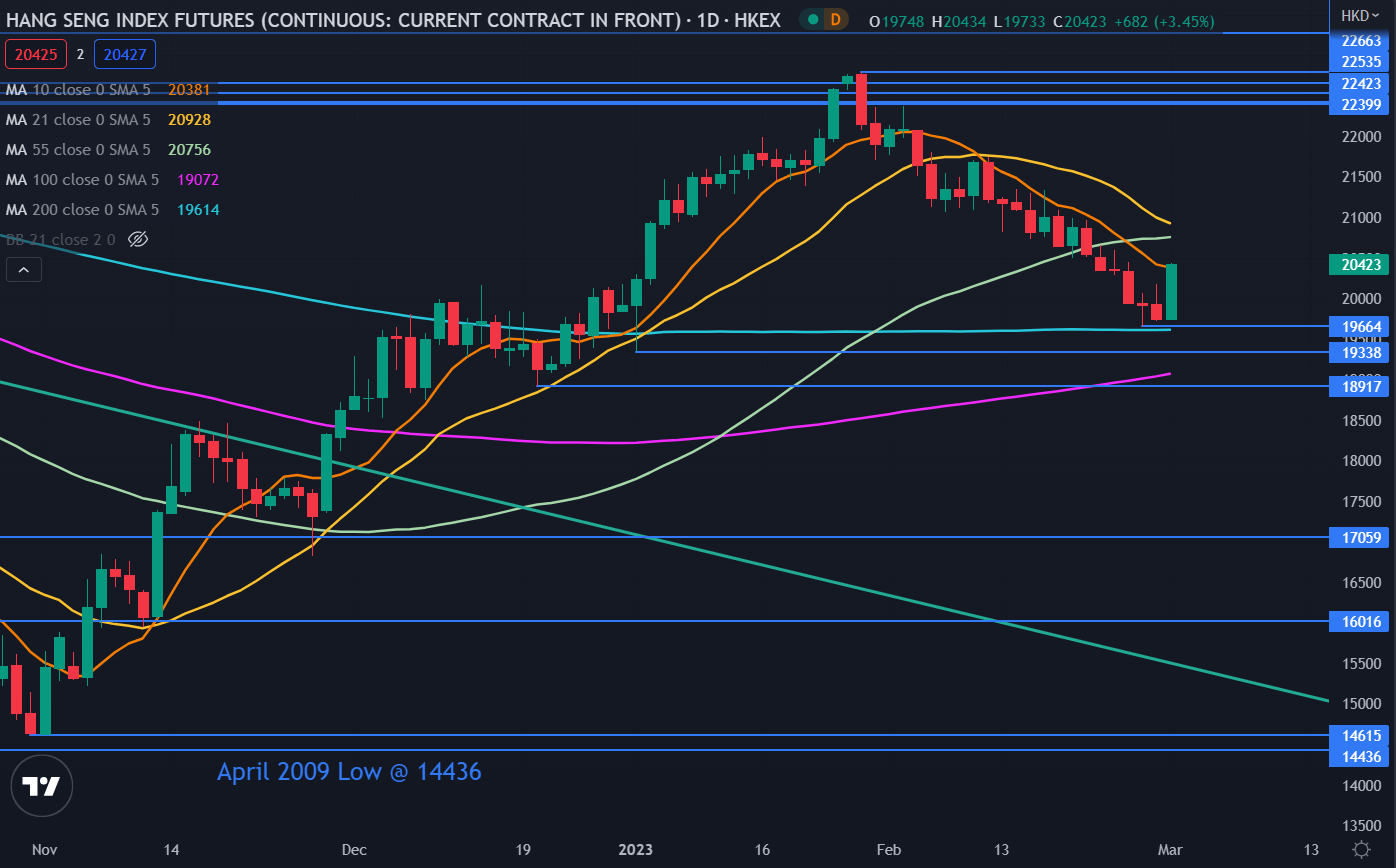
Chart created in TradingView
— Written by Daniel McCarthy, Strategist for DailyFX.com
Please contact Daniel via @DanMcCathyFX on Twitter