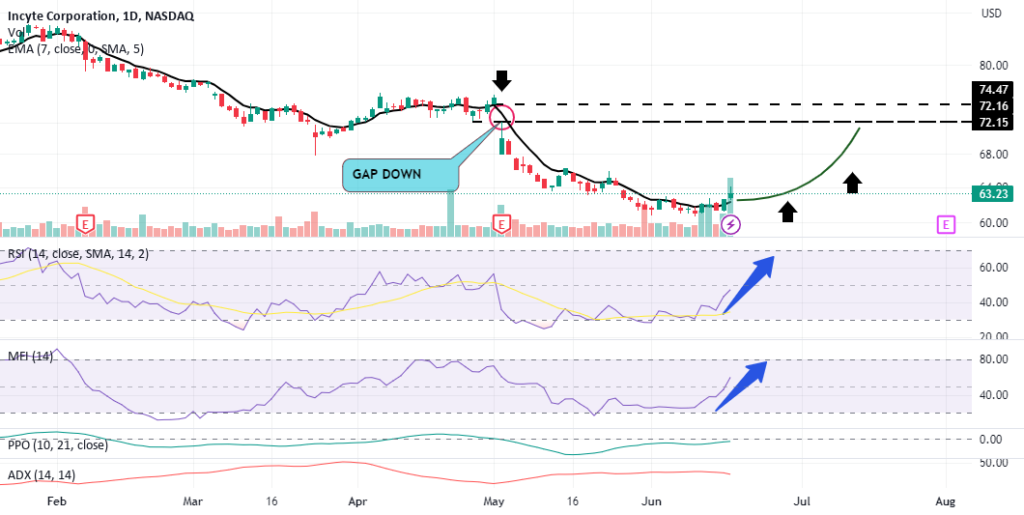
On this 5 Month Daily Chart of Incyte you can clearly see the Bearish Trend that included the last 6 weeks of each daily candle trending below the 7 Day EMA until just the last 2 trading days where the bottom was made and INCY finally broke above the 7 day EMA on very good strenth with much higher volume than anthing seen during this downtrend. The RSI for the Trend Reversal is showing very good strength and the Money Flow Index has developed a Bullish Divergence to confirm this as well.
My confidence is Very High that Incyte will have a 10-15 % Gain over the next 3 weeks as it gradually moves back up to fill the Gap Down on May 2nd as shown on the Chart.


