
Market Recap
Recommended by Jun Rong Yeap
Get Your Free Equities Forecast
Wall Street gained for the second straight day (DJIA +0.62%; S&P 500 +0.63%; Nasdaq +0.84%), as US Treasury yields took a breather despite a hawkish takeaway from the Jackson Hole Symposium. Both the US 2-year and 10-year yields cooled by around 5 basis-point (bp) overnight after touching their recent highs. The VIX has also hit its two-week low, potentially as hedging bets unwind from greater clarity on Fed’s policy outlook. Amid the quiet economic calendar to start the week, market focus will now turn to a series of macro data ahead to justify whether a November rate hike from the Fed is warranted.
Today’s schedule will leave Germany and US consumer confidence data on watch, along with the US Job Openings and Labor Turnover Survey (JOLTS), where further moderation in US July job opening numbers is expected (9.465 million forecast versus 9.582 million prior). The US S&P/Case-Shiller home price index will be in focus as well, with US home prices expected to mark its fourth straight month of year-on-year decline (-1.3% forecast versus -1.7% prior).
Perhaps one to watch may be the Russell 2000, which has been attempting to defend its 200-day moving average (MA) over the past week. Further upside may validate a bullish crossover on its moving average convergence/divergence (MACD) on the daily chart, with immediate resistance to overcome at the 1,900 level. On the broader scale, the index remains stuck in a long-ranging pattern since April 2022, with any move above the 1,900 level potentially leaving its upper bound at the key psychological 2,000 level on watch for a retest next.
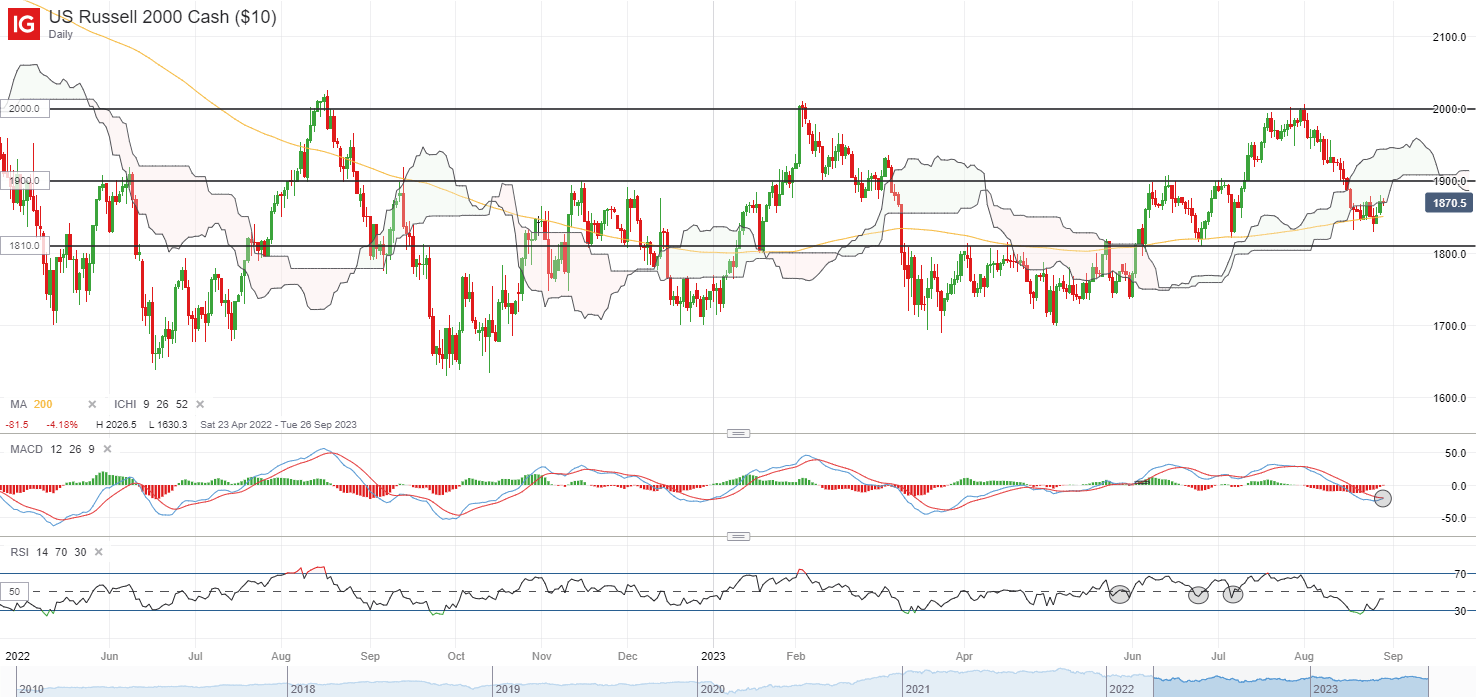
Source: IG charts
Asia Open
Asian stocks look set for a positive open, with Nikkei +0.50%, ASX +0.45% and KOSPI +0.34% at the time of writing. Lower Treasury yields, a slightly weaker US dollar and the positive handover from Wall Street provide room for some relief in the region, despite lingering reservations surrounding Chinese equities.
Beijing’s latest efforts to boost markets has been met with a lukewarm reaction, with gains in Chinese equities fizzling into the close yesterday. The Hang Seng Index was up as much as 3% at one point, but closed only 0.9% higher. Similar measure in 2008 eventually saw the CSI 300 move to form a new low, suggesting that a turnaround in economic conditions remains the key driving force for longer-term upside in Chinese equities.
This morning saw Japan’s July unemployment rate head higher to 2.7% from previous 2.5% (forecast 2.5%), with the sharper moderation in Japan’s labour market likely to provide more room for dovishness for the Bank of Japan (BoJ) by having a taming effect on wage pressures. For now, the USD/JPY has breached the 145.00-145.80 level, where previous yen-buying intervention was executed back in September 2022. While the overall trend remains up with a rising channel pattern in place, some near-term exhaustion seems to be in place, with a flat-lined MACD and lower highs on its RSI from the daily chart. The 145.00 level will be an immediate support to hold, failing which may pave the way to retest the 141.60 level next.
Recommended by Jun Rong Yeap
How to Trade USD/JPY
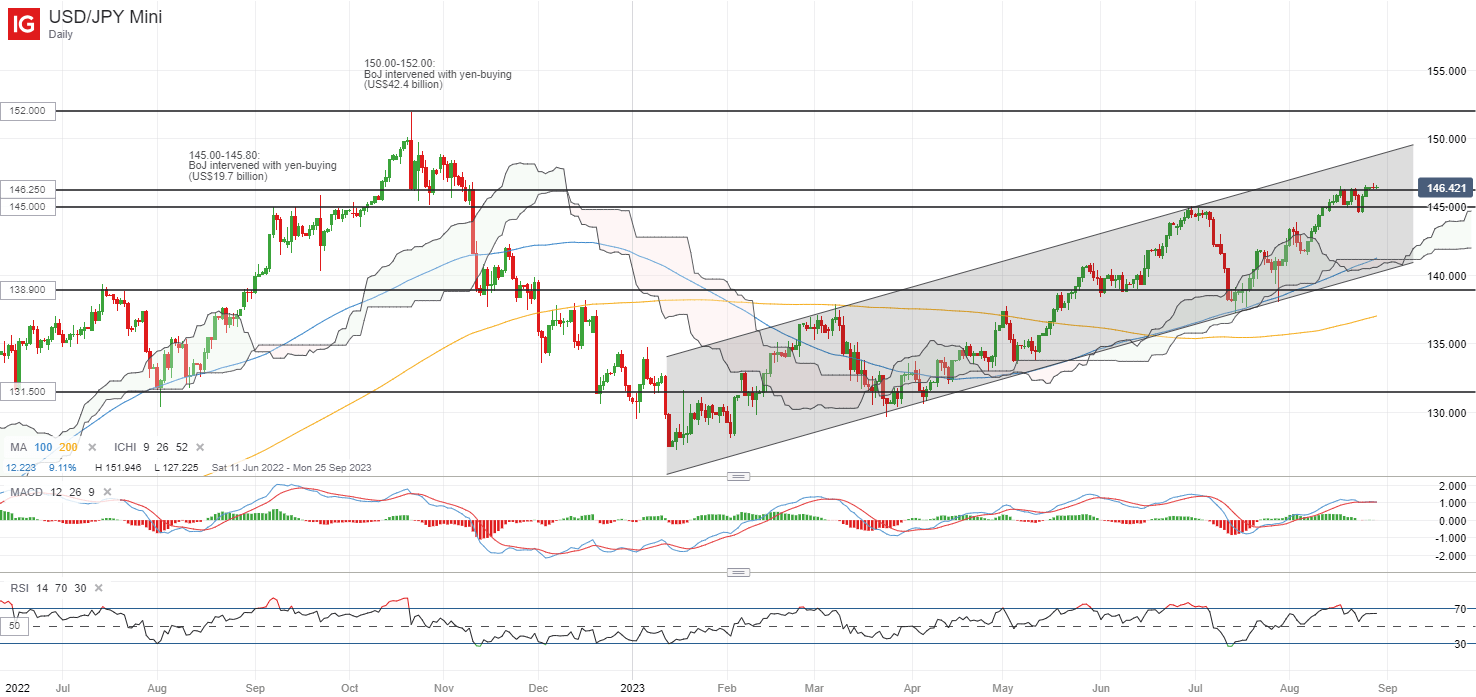
Source: IG charts
On the watchlist: GBP/USD retesting neckline of head-and-shoulder formation
The GBP/USD has retraced by close to 4.5% since mid-July this year, further weighed by weaker-than-expected PMI data out of the UK and some firming in the US dollar last week to retest its 1.260 level. On the broader scale, the 1.260 level seems to mark the neckline of a head-and-shoulder formation, with an attempt to stabilise after recent sell-off. Its weekly RSI continues to trade above the 50 level for now, which could still put an upward trend in place, but any failure to defend the 1.260 level over the coming days may potentially pave the way to retest the 1.231 level next.
of clients are net long. of clients are net short.
| Change in | Longs | Shorts | OI |
| Daily | 0% | 14% | 4% |
| Weekly | 22% | -15% | 5% |
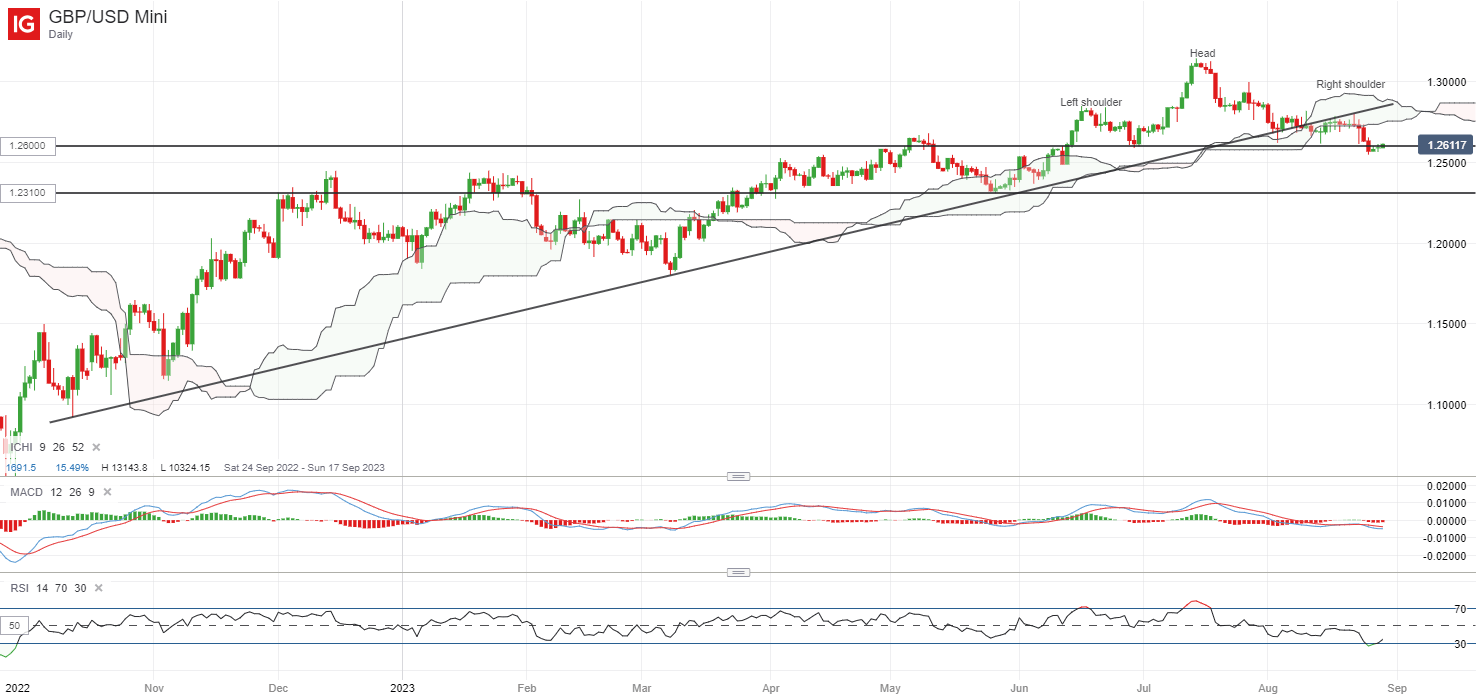
Source: IG charts
Monday: DJIA +0.62%; S&P 500 +0.63%; Nasdaq +0.84%, DAX +1.03%, FTSE +0.07%